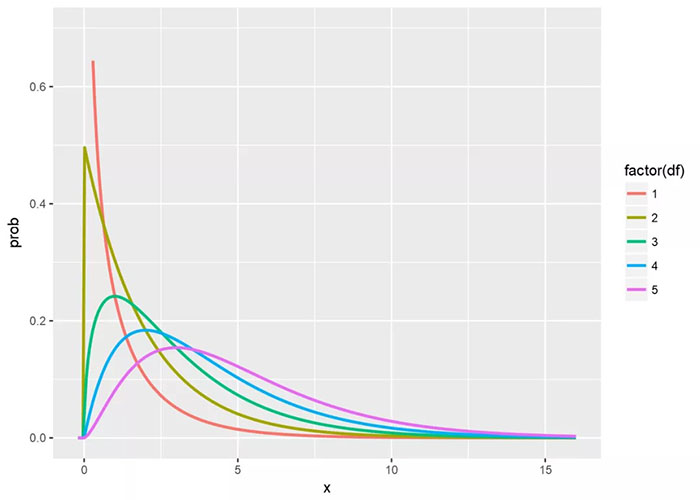
1. 卡方分布
当自由度趋于无穷大时,图形趋于正态分布
# 产生服从卡方分布的观测数为1000的样本df_n <- seq(1, 5)chisq_data <- function(n){ x <- seq(-0.2, 16, length=300) prob <- dchisq(x, df=n[1, 1]) return(data.frame(x=x, prob=prob, df=n[1,1]))}require(plyr, quietly=TRUE)require(ggplot2, quietly=TRUE)data <- ddply(data.frame(n=df_n), .(n), chisq_data)head(data)## n x prob df## 1 1 -0.20000000 0.000000 1## 2 1 -0.14581940 0.000000 1## 3 1 -0.09163880 0.000000 1## 4 1 -0.03745819 0.000000 1## 5 1 0.01672241 3.059352 1## 6 1 0.07090301 1.446043 1
tail(data)
## n x prob df## 1495 5 15.72910 0.003186504 5## 1496 5 15.78328 0.003117378 5## 1497 5 15.83746 0.003049697 5## 1498 5 15.89164 0.002983433 5## 1499 5 15.94582 0.002918558 5## 1500 5 16.00000 0.002855045 5
ggplot(data, aes(x=x, y=prob, color=factor(df), group=df))+geom_line(lwd=1)+scale_y_continuous(limits=c(0, 0.7))

其定义为:若n个相互独立的随机变量ξ₁、ξ₂、……、ξn ,均服从标准正态分布(也称独立同分布于 标准正态分布),则这n个服从标准正态分布的随机变量的平方和服从卡方分布
可加性:两个服从卡方分布的独立随机变量相加服从自由度为两自由度之和的卡方分布
卡方检验的基本思想:由于在假设符合某种情况的前提下,样本实际值偏离理论值的偏差服从正态分布,其均值为理论值,方差也为理论值???(有点疑惑)
2. 四格表资料的卡方检验
书上P98例7-2:表格为
| 组别 | 有效 | 无效 | 合计 |
|---|---|---|---|
| 胞磷胆碱组 | 46 | 6 | 52 |
| 神经节苷酯组 | 18 | 8 | 26 |
| 合计 | 64 | 14 | 78 |
H0:两种药物疗效相同 H1:有效率不等
table7_2 <- matrix(c(46, 18, 6, 8), nrow=2, ncol=2)chisq.test(table7_2)
## Warning in chisq.test(table7_2): Chi-squared approximation may be incorrect
#### Pearson's Chi-squared test with Yates' continuity correction#### data: table7_2## X-squared = 3.1448, df = 1, p-value = 0.07617
得到warning "Chi-squared approximation may be incorrect" 因为表格中有T<5, 此时可以采用校正【自动校正】或者fisher.test() 可以用以下代码查看理论值
chisq.test(table7_2)$expected
## Warning in chisq.test(table7_2): Chi-squared approximation may be incorrect
## [,1] [,2]## [1,] 42.66667 9.333333## [2,] 21.33333 4.666667
参考: http://r.789695.n4.nabble.com/In-chisq-test-x-Chi-squared-approximation-may-be-incorrect-td845040.html


