提琴图是常用统计图之一,能够较好的呈现数据中变量的分布区间以及密度范围。不过不同于箱线图,标准提琴图中不提供中位数、分位数等信息。但如果我们想在提琴图中标识中位数、上下四分位数的位置,或者观察各分位数区域大致包含的变量数量或分布密度等,该如何实现呢?
以下简单展示两种画法。
数据集概要
以ggridges包的lincoln_weather数据集为例,记录了2016年布拉斯加州林肯市的天气信息。数据集一共366行,即2016年的366个观测日;每一列代表了一种天气指标(如温度、湿度、风力等)或当前观测日的其它属性(如月份等)。
#示例数据集,可加载 ggridges 包后 ?lincoln_weather 查看概要
data(lincoln_weather, package = 'ggridges')
View(lincoln_weather)

一个简单的小提琴图和箱线图的叠加形式
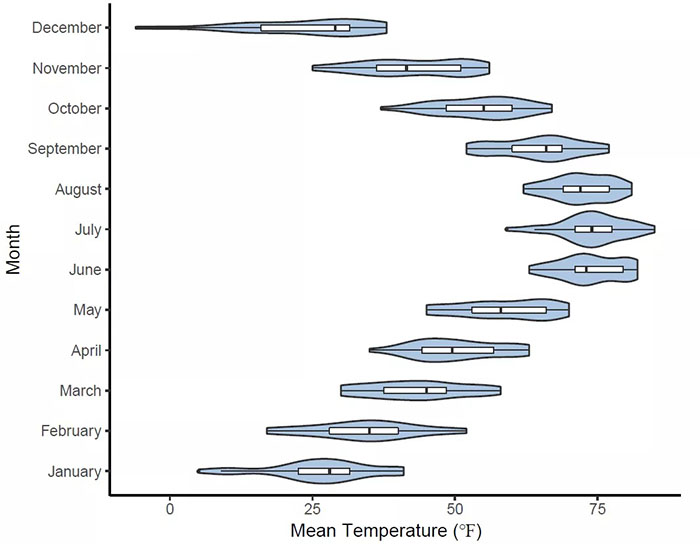
我们期望从该数据中,观察和比较每月温度的变动。因此,不妨考虑绘制箱线图或者提琴图等对每一个月份(数据集的“Month”列)中,日平均气温(数据集的“Mean Temperature [F]”列)的分布进行可视化。
先来看一种很常见的作图形式,提琴图叠加箱线图,既较好地呈现了数据分布的密度状态又提供了分位数信息。
##使用 ggplot2 绘制箱线图或提琴图,展示每个月份的日平均气温的分布
#选择数据便于作图
dat <- data.frame(lincoln_weather[c('Month', 'Mean Temperature [F]')])
names(dat) <- c('Month', 'Mean_Temperature')
dat$Month <- factor(dat$Month, levels = rev(levels(dat$Month)))

#如下是一个简单的提琴图示例
library(ggplot2)

p <- ggplot(dat, aes(x = Month, y = Mean_Temperature)) +
coord_flip() +
theme(panel.grid = element_blank(), panel.background = element_blank(),
    axis.line = element_line(color = 'black')) +
labs(x = 'Month', y = 'Mean Temperature (℉)') +
geom_violin(fill = '#ADC6E1', size = 0.5)

p

#可以在提琴图上方叠加一个小箱线图,额外指示分位数信息
p +
geom_boxplot(fill = 'white', outlier.size = 0.5, width = 0.15, size = 0.3)

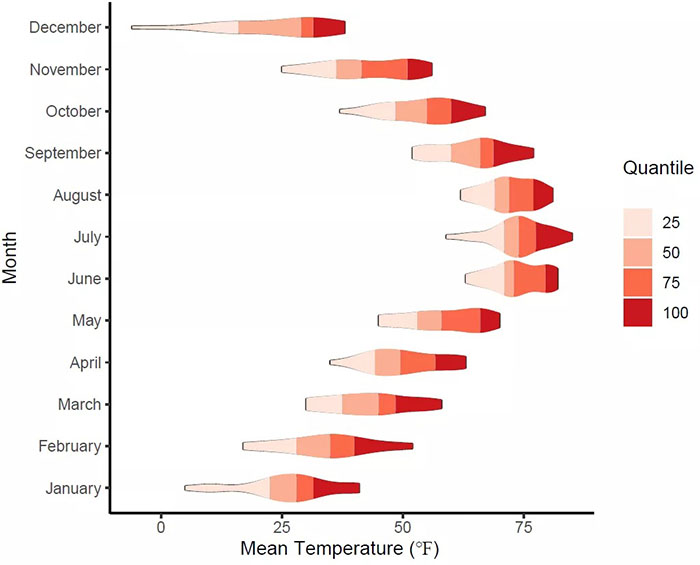
一个在提琴图中添加填充阴影指示分位数的形式
其实在上图中,提琴图和箱线图的叠加形式,已经将分位数信息呈现出来了。
这里再展示另一种比较花哨(虽然没啥用)的作图方法,在提琴图中以不同填充色的形式,表示出不同分位数的区域。这个是偶然间在一个网站上看到的,觉得效果还行,就把他们的函数拿过来改了改。
library(dplyr)

coords <- ggplot_build(p)$data        # use ggbuild to get the outline co-ords
d <- coords[[1]]                      # this gets the df in a usable form
groups <- unique(d$group)             # get the unique 'violin' ids

# function to create geom_ploygon calls
fill_viol <- function(data, val_x, val_y, v, gr) {
    quants <- mutate(v, x.l = x-violinwidth/2, x.r = x+violinwidth/2, cuts = cut(y, quantile(data[as.numeric(data[[val_x]])==gr,val_y])))  # add 1/2 width each way to each x value
    plotquants <- data.frame(
        x = c(quants$x.l, rev(quants$x.r)),      # left x bottom to top, then right x top to bottom
        y = c(quants$y, rev(quants$y)),          # double up the y values to match
        id = c(quants$cuts, rev(quants$cuts))    # cut by quantile to create polygon id
    )
    geom_polygon(aes(x, y, fill = as.factor(id)), data = plotquants)    # return the geom_ploygon object
}

p +
lapply(groups, function(x) fill_viol(data = dat, val_x = 'Month', val_y = 'Mean_Temperature', v = d[d$group==x, ], gr = x)) +    # plus polygon objects for each violin
scale_fill_brewer(palette = 'Reds', name = 'Quantile\n', labels = c('25','50','75','100'))    # plus fill


